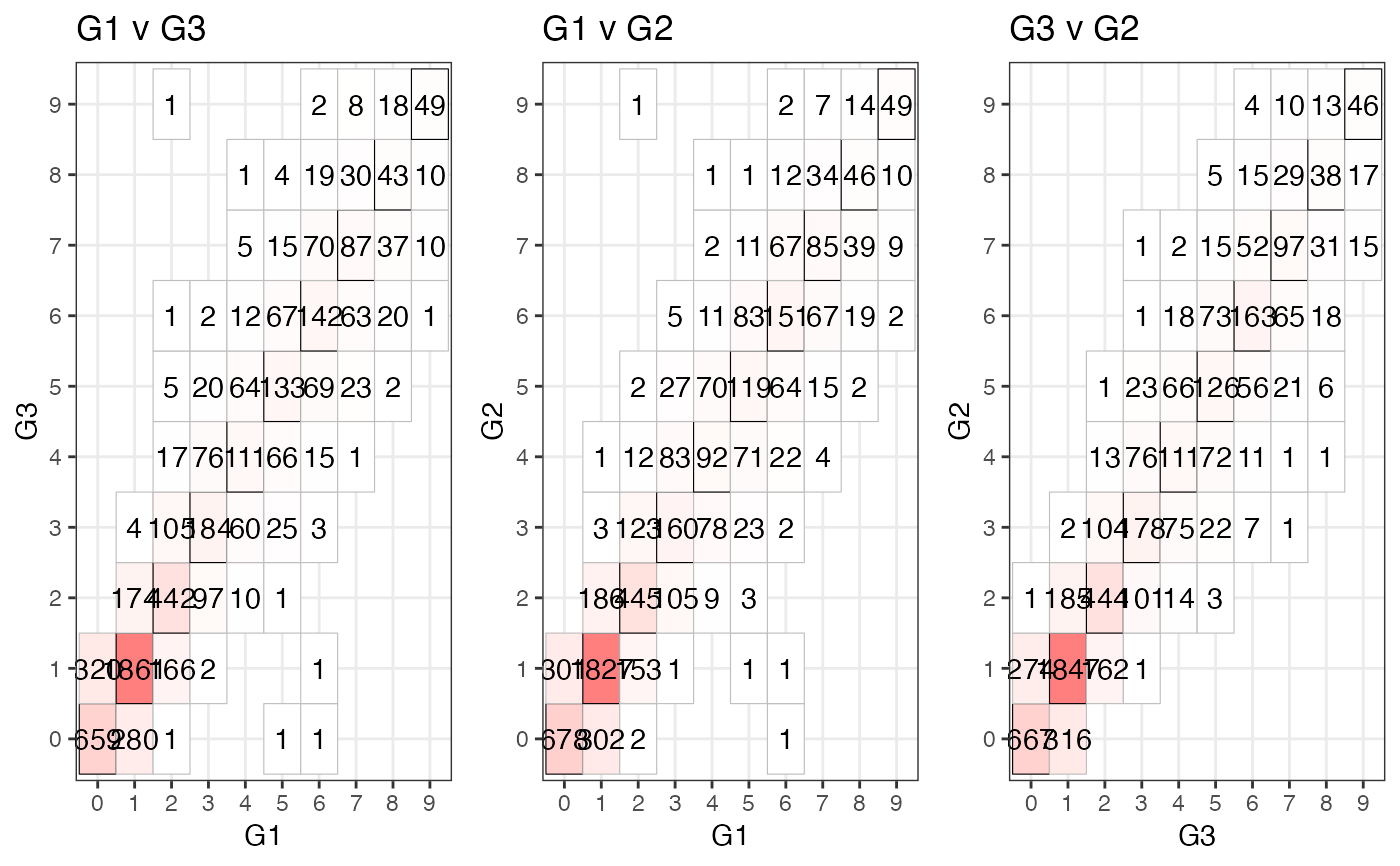
Pairwise Heatmaps (Discrete Traits)
pairwise_heatmap.RdThis function plots pairwise heatmaps of all graders in the input data-frame on any discrete variable of interest.
Arguments
- df
Data-frame in long format.
- device_status
A boolean denoting if df is the device data-frame; default assumes grader data-frame. This parameter is arbitrary if your df2 is not null.
- variable
A valid column name denoting the variable of interest
Examples
data("expert_graders", package = "meatrics")
pairwise_heatmap(expert_graders, device_status = FALSE, variable = "aus_marbling")
