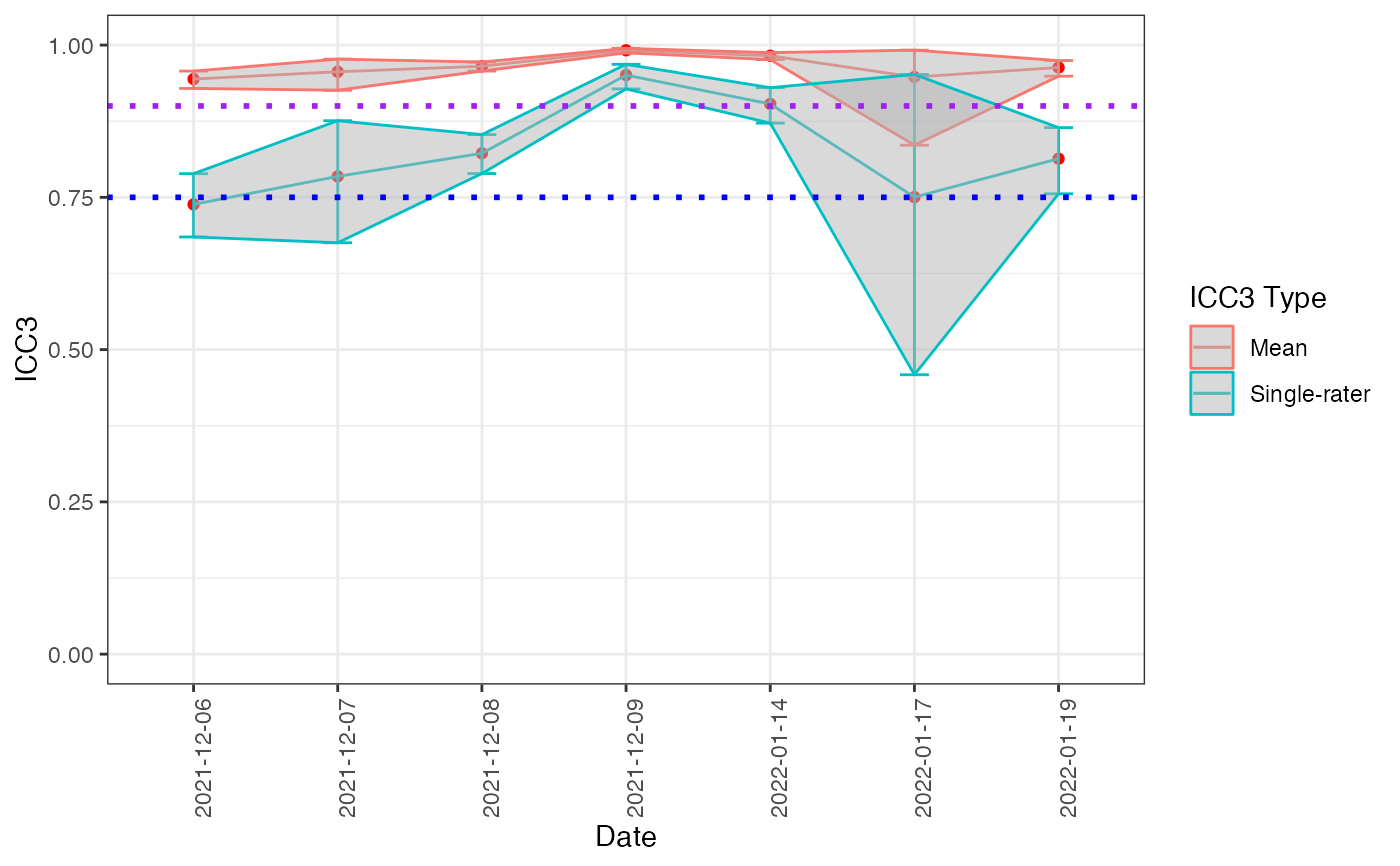
ICC3 and ICC3K Line Chart over Time
icc_line.RdICC3 and ICC3K Line Chart over Time
Arguments
- df
Input dataframe in long format.
- df2
Input device dataframe in long format.
- variable
A valid column name denoting the variable of interest.
- filtered
A character vector of graders you want included in the ICC; can be a mix of both dataframes, If it does not include any grader name from one data-frame, all graders from that data-frame will be used.
