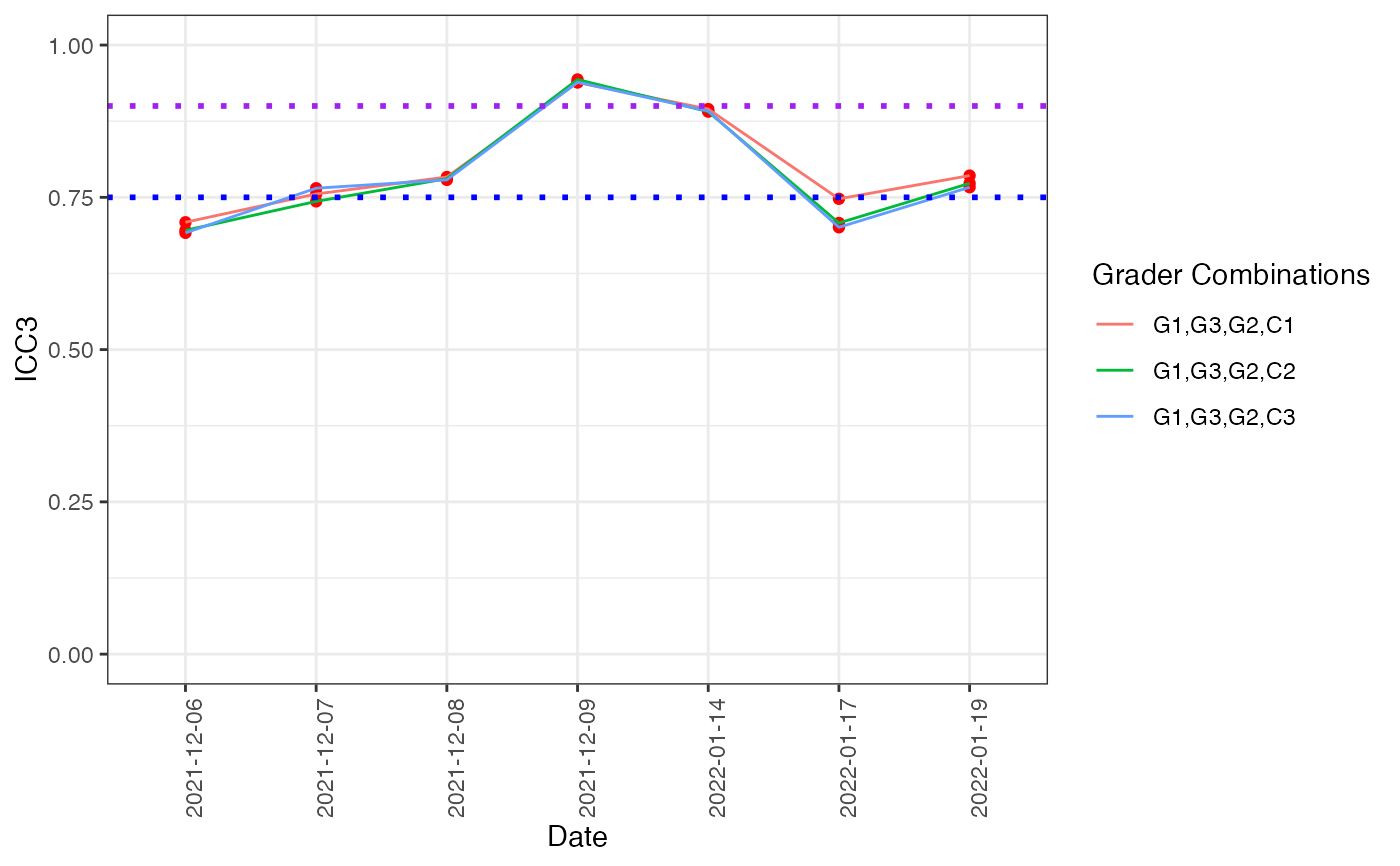
ICC Line Chart over Time (Singular Device v Group of Expert Graders)
icc_device_comparison.RdThis function computes the ICC(3,1) value for each date grouping expert graders and one device at a time to assess any significant difference between how each device compares to the expert graders.
Arguments
- df
Input expert grader data-frame in long format.
- df2
Input device data-frame in long format.
- variable
A valid column name denoting the variable of interest.
- grader_count
An integer denoting the number of expert graders there are.
Examples
data("expert_graders", package = "meatrics")
data("devices", package = "meatrics")
icc_device_comparison(expert_graders, devices, variable = "msa_marbling", grader_count = 3)
#> boundary (singular) fit: see help('isSingular')
#> boundary (singular) fit: see help('isSingular')
#> boundary (singular) fit: see help('isSingular')
