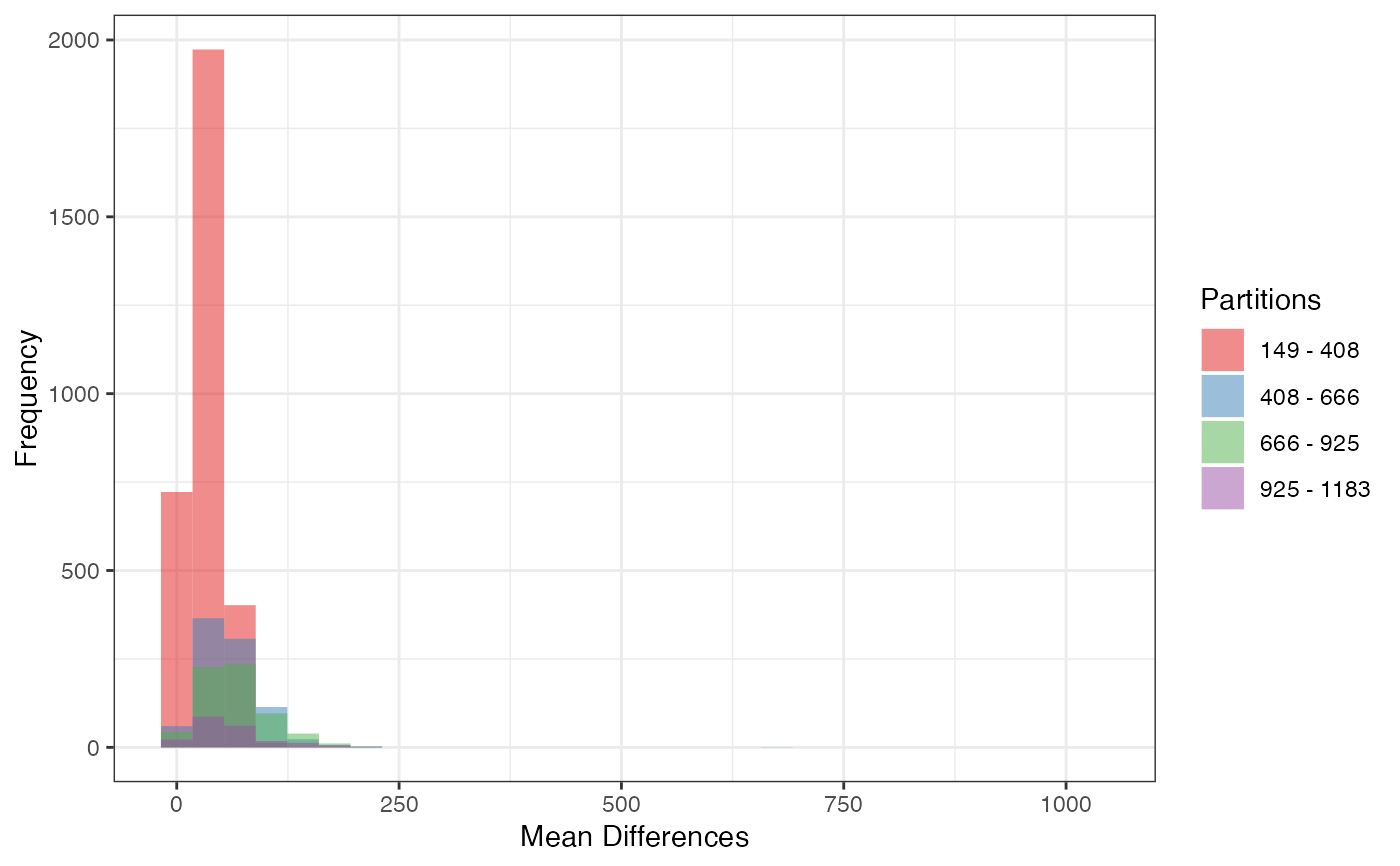
Histogram of Grader Differences
diff_histogram.RdThis function computes pairwise differences of all graders available in the data-frame and outputs the result as a histogram. It then summarises these differences by either taking the mean, median or maximum difference. It allows for partitions in the variable of interest to be made so that differences can be more clearly observed along the entire range of the variable.
Usage
diff_histogram(
  df,
  device_status = FALSE,
  variable,
  partitions = 1,
  grader_count = 3,
  bins = 30,
  diff_type = "mean"
)
Arguments
- df
Input dataframe in long format.
- device_status
A boolean denoting if df is the device data-frame; default assumes grader data-frame.
- variable
A valid column name denoting the variable of interest.
- partitions
An integer specifying how many groups to split the variable into.
- grader_count
An integer specifying how many graders are in the data-frame.
- bins
An integer specifying what bin-size.
- diff_type
Either "mean", "median" or "maximum", specifying what kind of difference to take; default is mean.
Examples
data("expert_graders", package = "meatrics")
diff_histogram(expert_graders, variable = "msa_marbling", partitions = 4, grader_count = 3)
