Device Images Comparisons
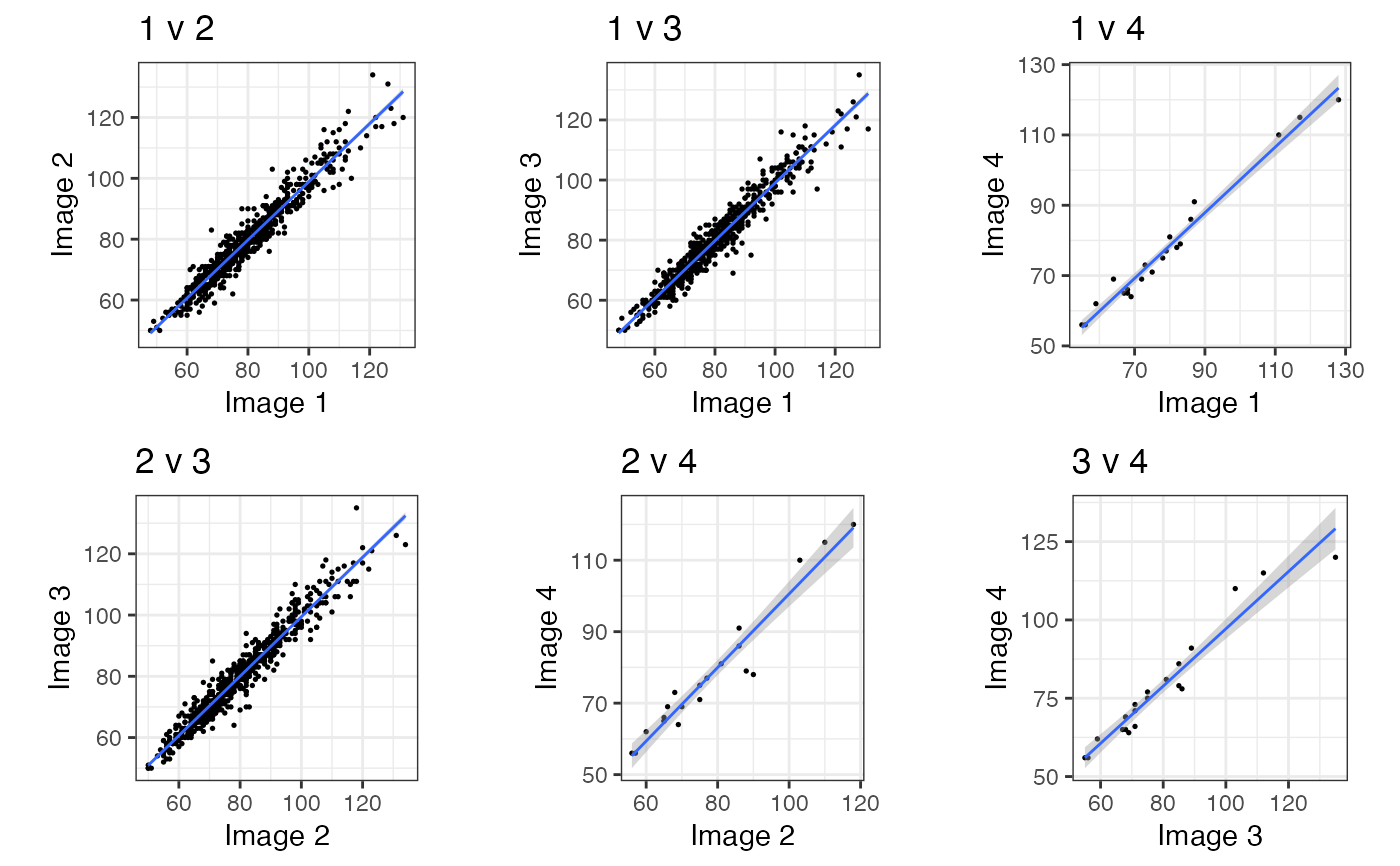
device_image_comparison.RdDevices take 3 or 4 images, often with different ratings. This function visualises the grades between the images for a certain within the data-frame in either a heatmap or a scatterplot, depending on if the trait measured is discrete or continuous.
Arguments
- df
Device data-frame in long format.
- variable
A valid column name denoting the variable of interest.
- device_name
Device of interest.
Examples
data(devices, package = "meatrics") # load the data
device_image_comparison(devices, "meat_colour", device_name = "C1")

device_image_comparison(devices, "ema", device_name = "C2")
